Future home for Current Lost and Found Pets on Craigslist
~Scroll Down~ for some charts and graphs I competed a while ago
I have not been keeping track of (and charting) lost and found pets since the late 1980’s. That’s a couple of decades! After Fukushima and with a renewed concern for earthquakes, I resumed my old routine of adding up the number of lost and found dogs and cats. Then I placed the numbers into a chart so that we might be able to see the same trends as I did originally (and so successfully). I visited and looked within my old haunts, the newspaper classified ads, yet was sorely disappointed! The Seattle Times had something like ONE missing dog! That was not going to make a very interesting or relevant chart. I checked the LA Times and found the same thing. So I asked myself, “Where would I advertise a lost a pet? – Craigslist!”
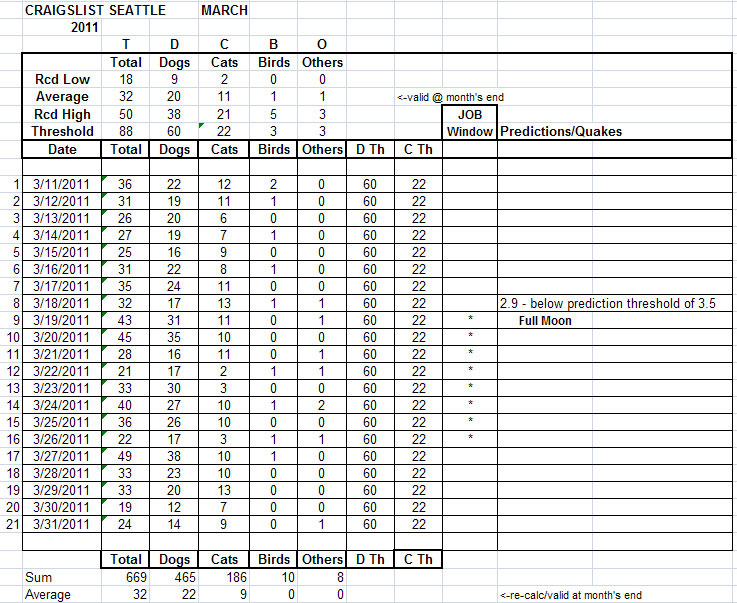
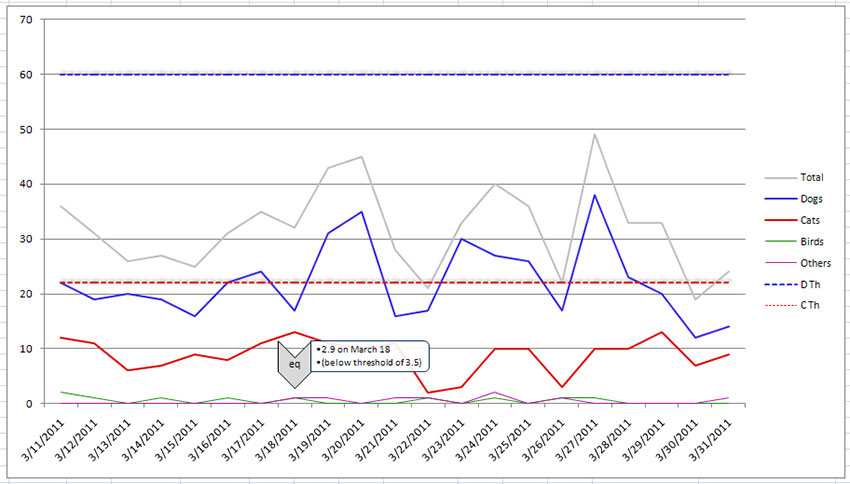
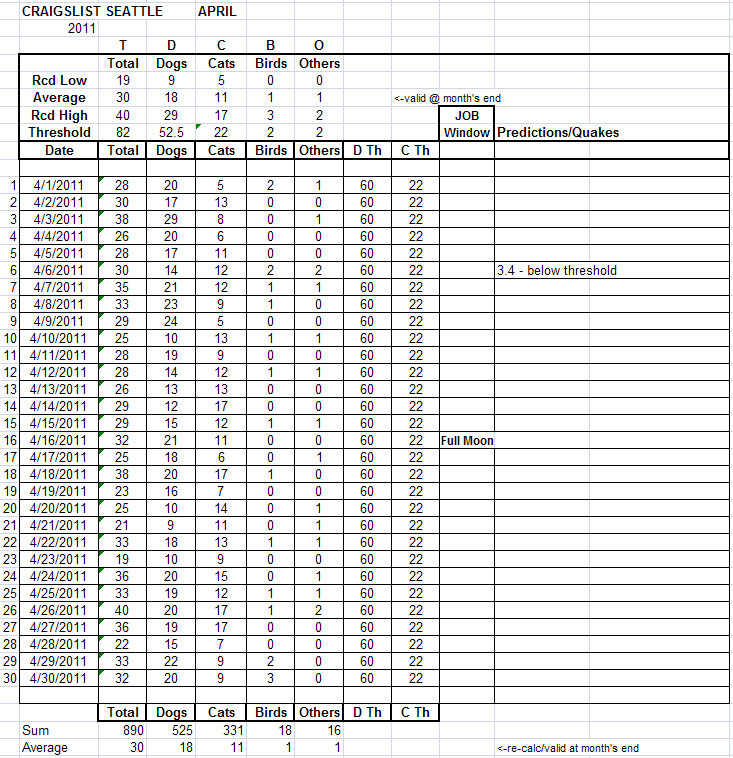
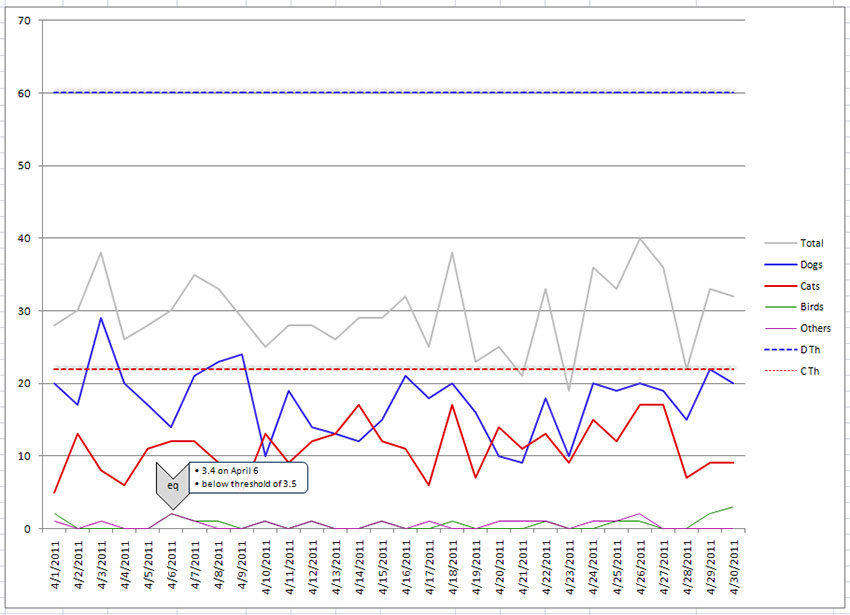
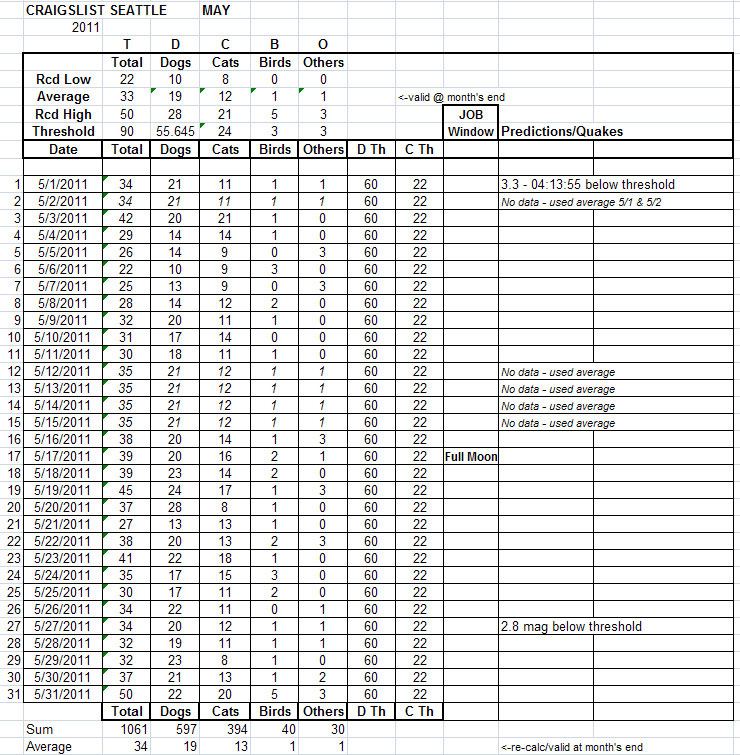
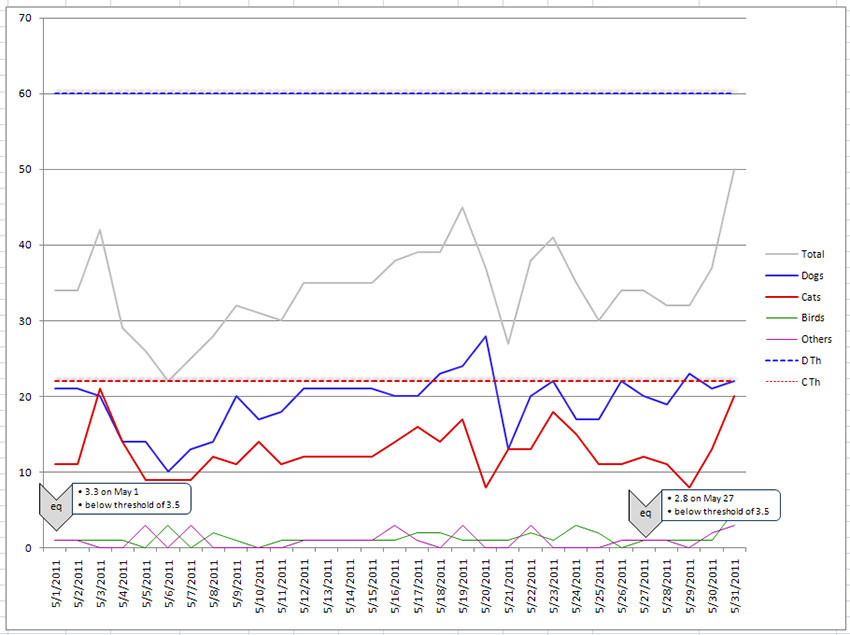
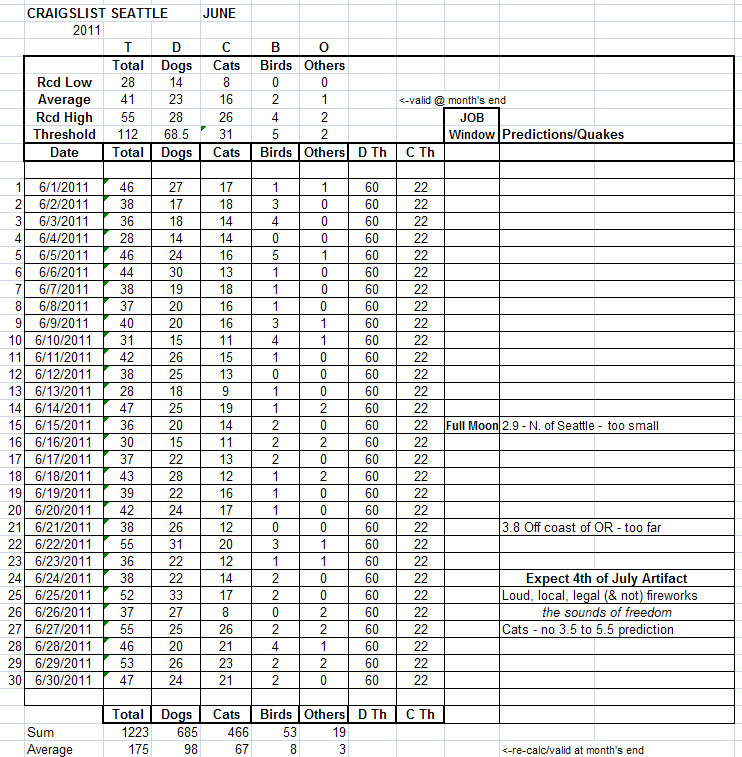
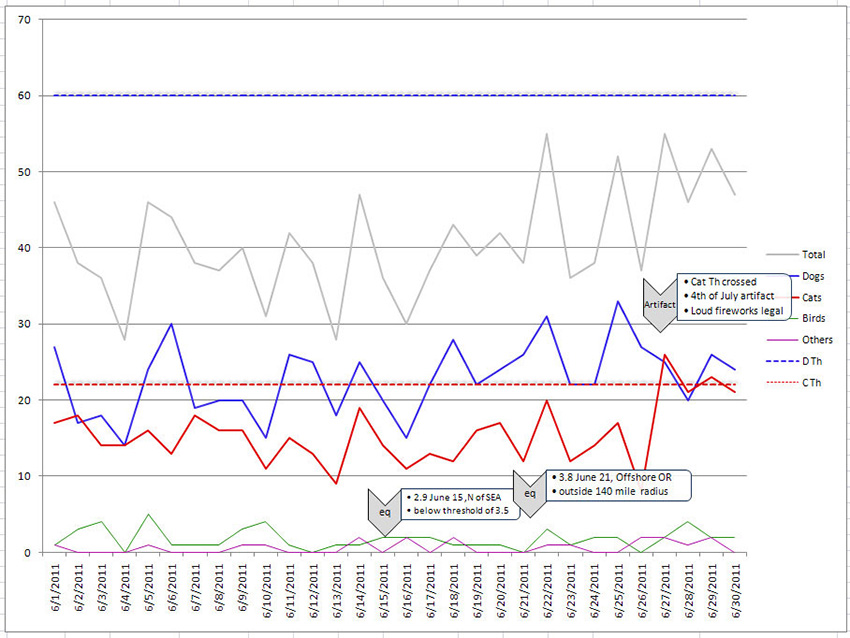
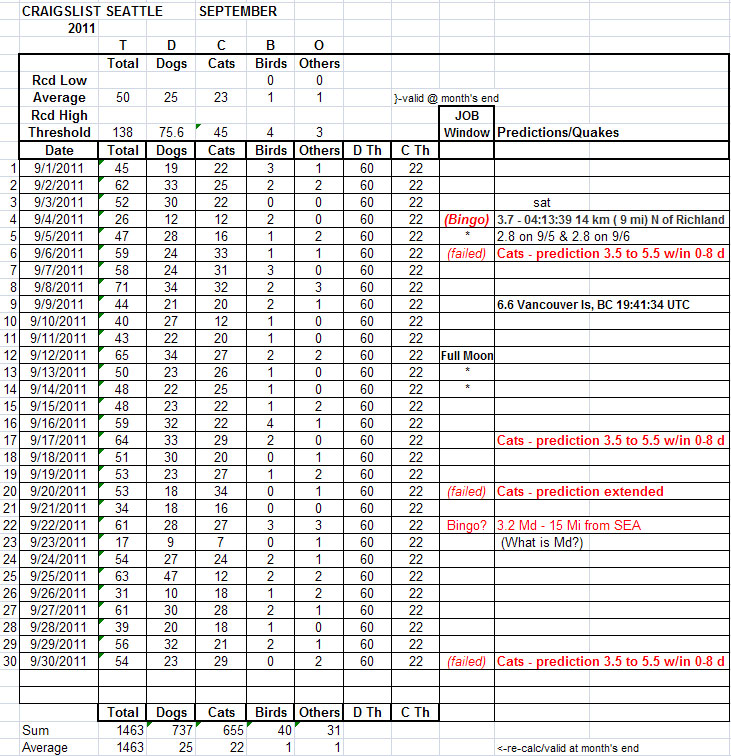
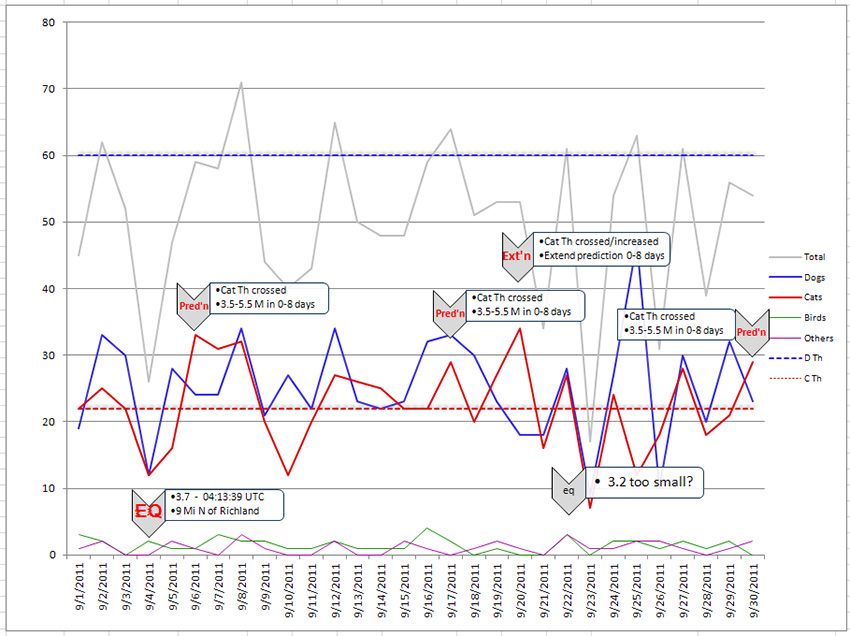
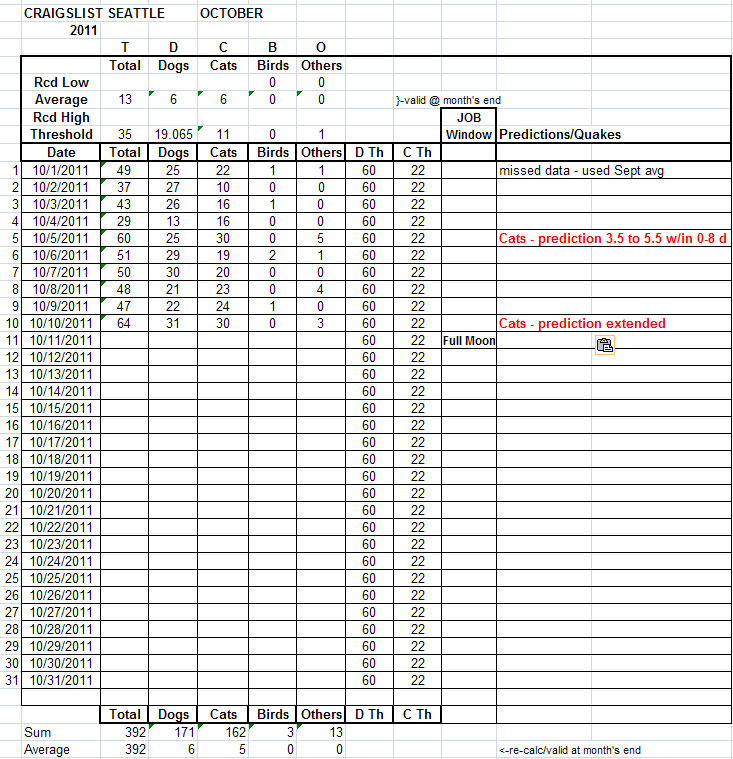
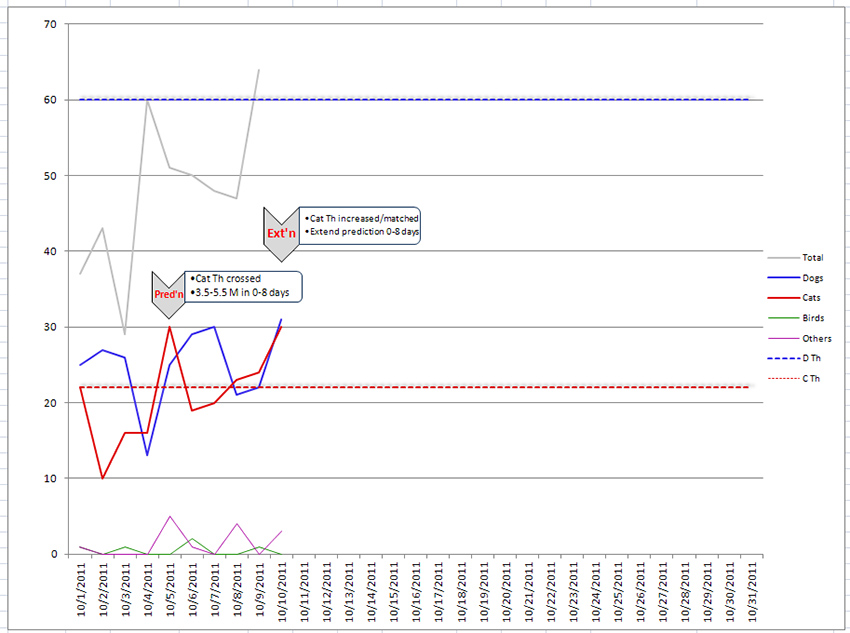
Since the beginning of the Fukushima disaster (it’s still the beginning), besides trying to figure out how to build a website, I began charting the lost and found pets from Craigslist just like I used to do. I have collected the actual numbers in order to make a chart. Eventually we’ll be able to see if the numbers are again relevant and predictive. I’ll post a monthly database with the number of lost and found pets, followed by a chart, so that perhaps we can visualize trends. For the beginning prediction thresholds (Th), I just doubled the cat’s and tripled the dog’s average totals. These thresholds may need adjustment sometime in the future.
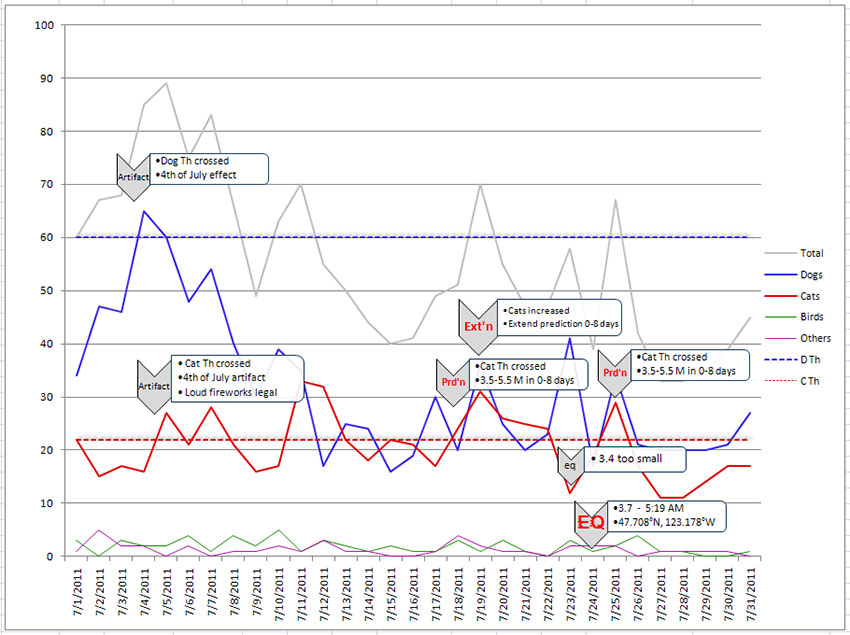
You may notice what appears to be a prediction threshold around the 4th of July. It’s a false alarm; an “artifact.” Do you know why animals become scared and bolt or run away during that holiday? I bet you do….Ka-BOOM! <–That’s why.
On July 11th, the cats numbers indicated the next possible prediction. This one failed. I really wonder if this was also because of the fireworks. Generally, this area naturally makes the most noise on the 4th, yet the fireworks stands are open for a couple of weeks before and after the holiday. Some of the newer devices are LOUD! (Like, OMG-LOUD!) I know some people make very loud sparkler bombs. I also know that some neighbors like to make what they call an oxy-acetylene bomb. This is usually a plastic bag, plastic bottle or balloon filled with cutting torch gases and some kind of a fuse. I am not sure exactly how that’s done, yet I know one has to be very careful because these bombs may be able to blow all the leaves off of a tree as well as all the windows out of a house. I suppose delicate eye and ear tissues might also be vulnerable, too. Oh! One other small detail: I bet homemade bombs are now called IEDs or incendiary devices, are probably very illegal…and if caught, the maker might be charged under the new anti-terrorist laws. One more thing: handling balloons that can build-up a static-charge, which can make a spark, and that are filled with highly flammable gases may win someone a Darwin Award.
As long as I have digressed a little, I’ll mention that I’ve seen a photo where the car roof was bulging-up and all the windows were blown out when some genius transported some gas-filled balloons in the back seat of a car. Here’s a video of another oxy-acetylene explosion. There’s not really much to see here, and I know that the audio does not come anywhere close to what these are like in person, I believe the echo after the explosion gives an idea and is worth the 59 second wait.
My point is that there can be a LOT of noise around here before and after the actual holiday, and as much as I appreciate what I call “the sounds of freedom,” these sounds can severely frighten our animal friends and lead to inflated numbers of lost and found pets. For about 5 days after the 4th, things were pretty quiet. Then, I noticed more noise again. Anyway, the prediction generated on the 11th of July may have been a pure failure, or may have been an artifact or remnant of the 4th of July-generated lost and found pets numbers.
Successful Prediction!
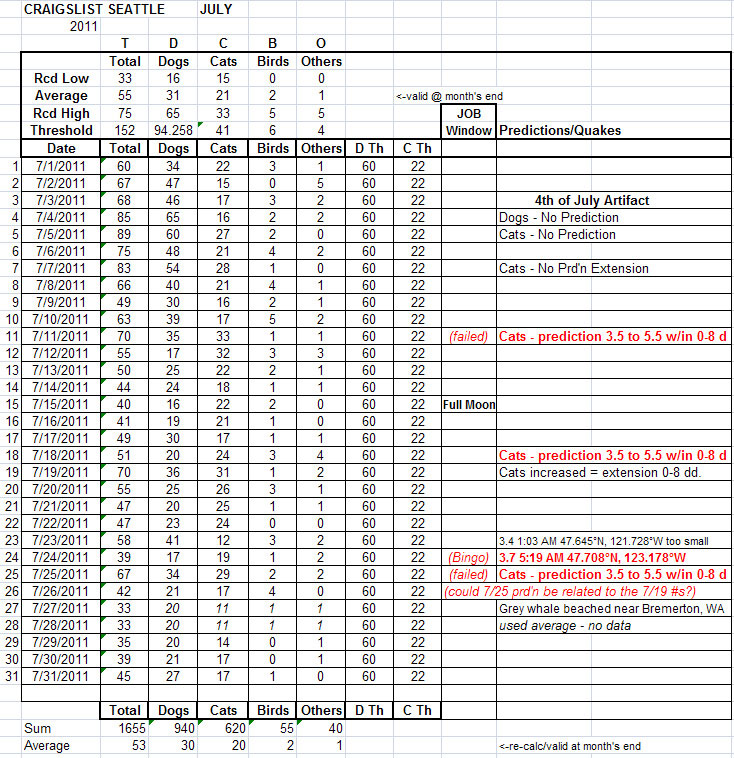
You can see on the spreadsheet and chart images below that on July 18th, the cat threshold was crossed so a prediction was made for a 3.5 to 5.5 magnitude earthquake within 0 to 8 days, and within a 140 mile radius of Seattle. On the 19th, the cats number increased so the timing window was extended with a new 0 to 8 day prediction. This would take us out to the 27th.
Four days later on the 23rd, there was a 3.4 magnitude inside the target area. Close, but no cigar. This was .1 magnitude too small to officially qualify as a successful hit. The next day we had a 3.7 magnitude and a Bingo! That qualified as the first successful hit since I resumed counting in March of 2011. It also serves as a very good illustration of how you, too, may be able to learn how to predict earthquakes using lost and found pets!
My next update will have a note that a Grey Whale was found beached near Bremerton, WA. Beached whales and porpoises (and Oarfish) may be signs worth paying attention to.
I’ll also note that the change from using newspaper ads to Craigslist numbers may have changed the predictive landscape a little. Still, this is essentially what I used to do decades ago which gave me a better than 90% success rate over a three-year time period.
JULY COMMENTS
Looking over the July chart, I see one bingo, one failed, and one probably failed. I’ll mention here that using Craigslist as a source for numbers is a new thing for me…and I have not been watching the numbers in a long time. I hope it is a little like riding a bike!
COMMENTS ON AUGUST
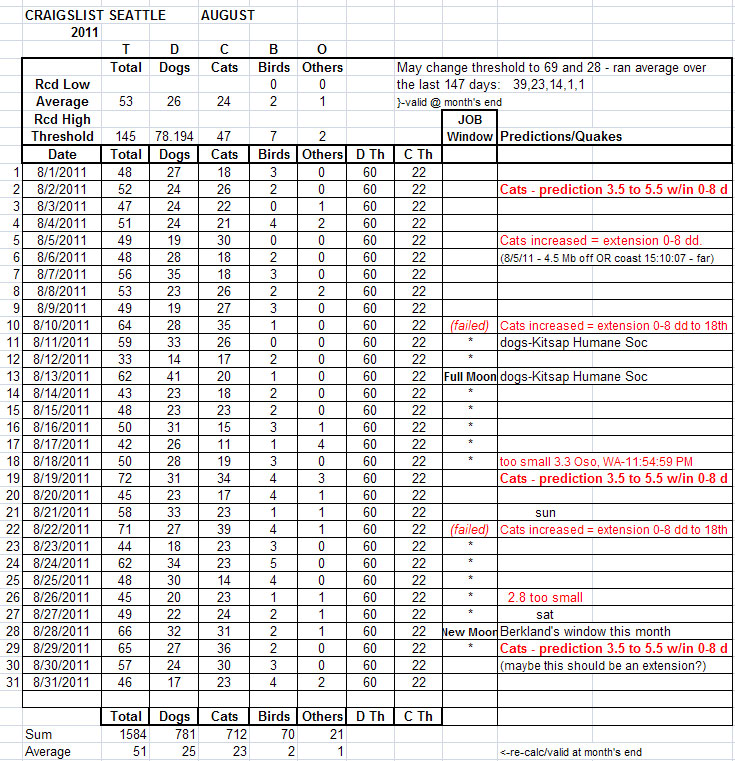
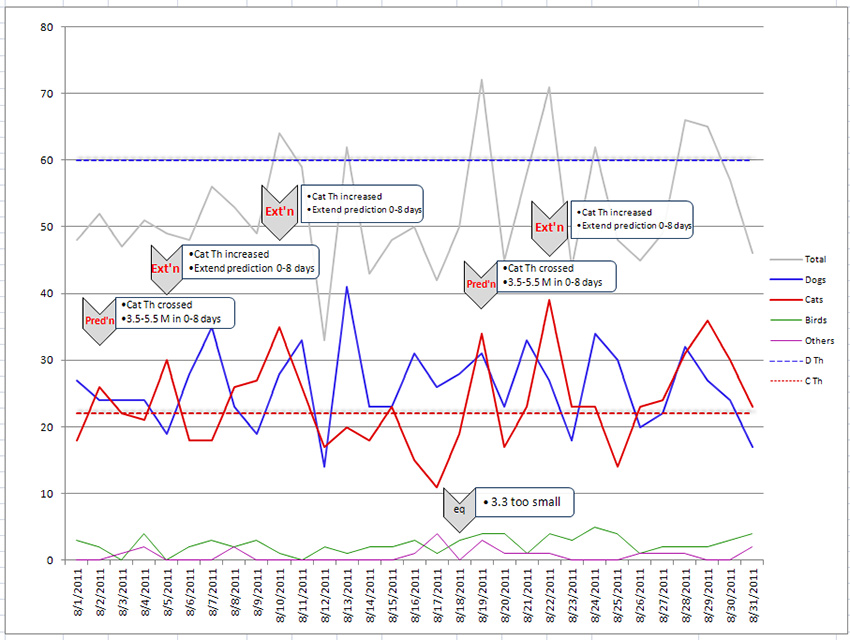
On August 2, cats total triggered a prediction. Higher numbers on the 5th and the 10th triggered two extensions of the window. This still failed to produce a hit since the prediction is for a 3.5-5.5, and on the last day of the window, there was only a 3.3.
I’ll have to look into what Mr. Berkland told me the other day; something about the USGS using a different scale which changes the actual magnitude reported…kind of like the work of a Spin Dr. If this is true, there may have been a bingo on the 18th.
On August 19th cats triggered a prediction which again was extended to the 29th due to higher numbers on the 22nd.
Last month Jim Berkland mentioned that for some reason (tides I think) he was tending to favor the new moon period on his prediction window during August. That occurs on the 28th. We’ll see.
(and I see that I need to re-image the data as I’ve made it too fuzzy by over-optimizing/shrinking the files. It’s legible, just not attractive.)
COMMENTS
I believe that re-visiting the numbers and the patterns may be needed so that we can see correlation, or not. It’s June, 2012 and I am still collecting animal numbers. I have to total them, chart them, and correlate that data with USGS earthquake information. Someone want to lend me a secretary? lol


